Chart of the Day: Three Years on Average
Contents
About the Author

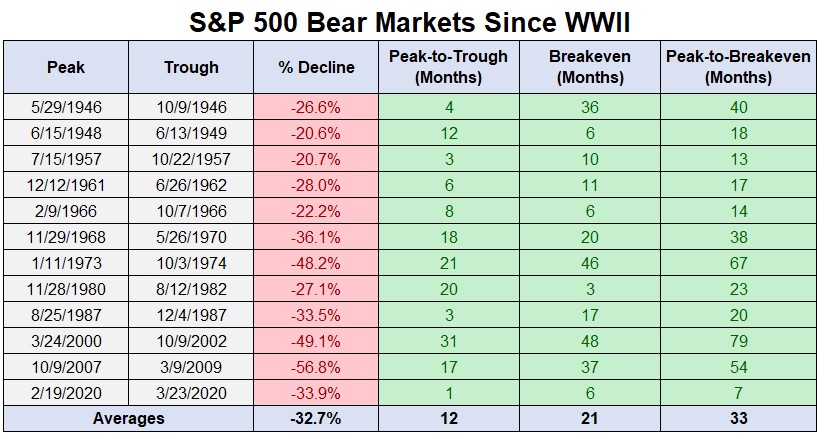
Today’s Chart of the Day comes from A Wealth of Commons Sense and shows the number of “bear markets,” years with a 20%+ loss, since World War II. We were awfully close to one in 2022 with a 19% loss.
Clients ask, “Why do you suggest maintaining the range of a minimum of three years, with an average of seven, and a maximum of 10 years of spending in bonds?” The reason is, on average, markets are down three years, with the longest being seven. However, there was one period (in the extreme) in 1999 and 2008 where we had two bear markets that were very close. When combined, the market was down close to 10 years.
As we enter 2023, it is important to remain patient. We are only one year into this, and based on history, it’s not uncommon to experience another year or two before we work our way out.
Samuel serves as Senior Vice President, Chief Investment Officer for the Crews family of banks. He manages the individual investment holdings of his clients, including individuals, families, foundations, and institutions throughout the State of Florida. Samuel has been involved in banking since 1996 and has more than 20 years experience working in wealth management.
Investments are not a deposit or other obligation of, or guaranteed by, the bank, are not FDIC insured, not insured by any federal government agency, and are subject to investment risks, including possible loss of principal.