Chart of the Day: Real Returns
Contents
About the Author

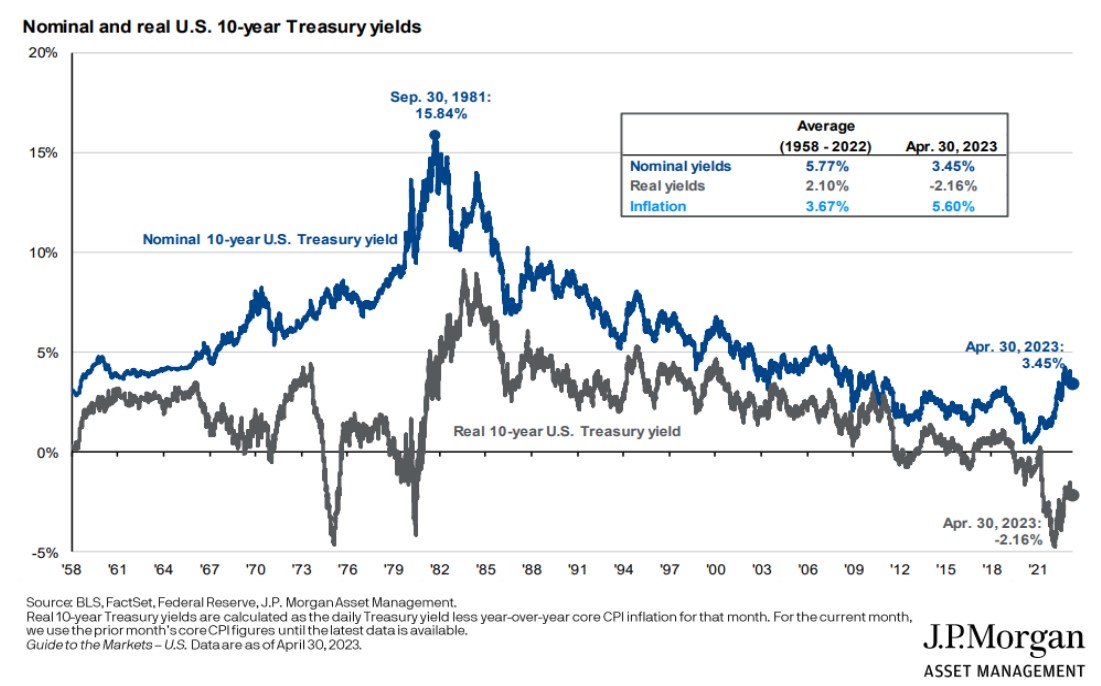
Today’s Chart of the Day from J.P. Morgan shows the history of the 10-year Treasury yield and the “real” yield, which is what you have left after you subtract inflation. Even with the current rate of 3.8% as of mid-June 2023, when you subtract the current inflation of 4%, your “real” return is still -0.2%. Sadly, even though this number is improving, the real yield on bonds has been nearly zero or negative for the last 10 years.
Samuel serves as Senior Vice President, Chief Investment Officer for the Crews family of banks. He manages the individual investment holdings of his clients, including individuals, families, foundations, and institutions throughout the State of Florida. Samuel has been involved in banking since 1996 and has more than 20 years experience working in wealth management.
Investments are not a deposit or other obligation of, or guaranteed by, the bank, are not FDIC insured, not insured by any federal government agency, and are subject to investment risks, including possible loss of principal.