Selling Low
Contents
About the Author

The rule of thumb is to buy low and sell high.
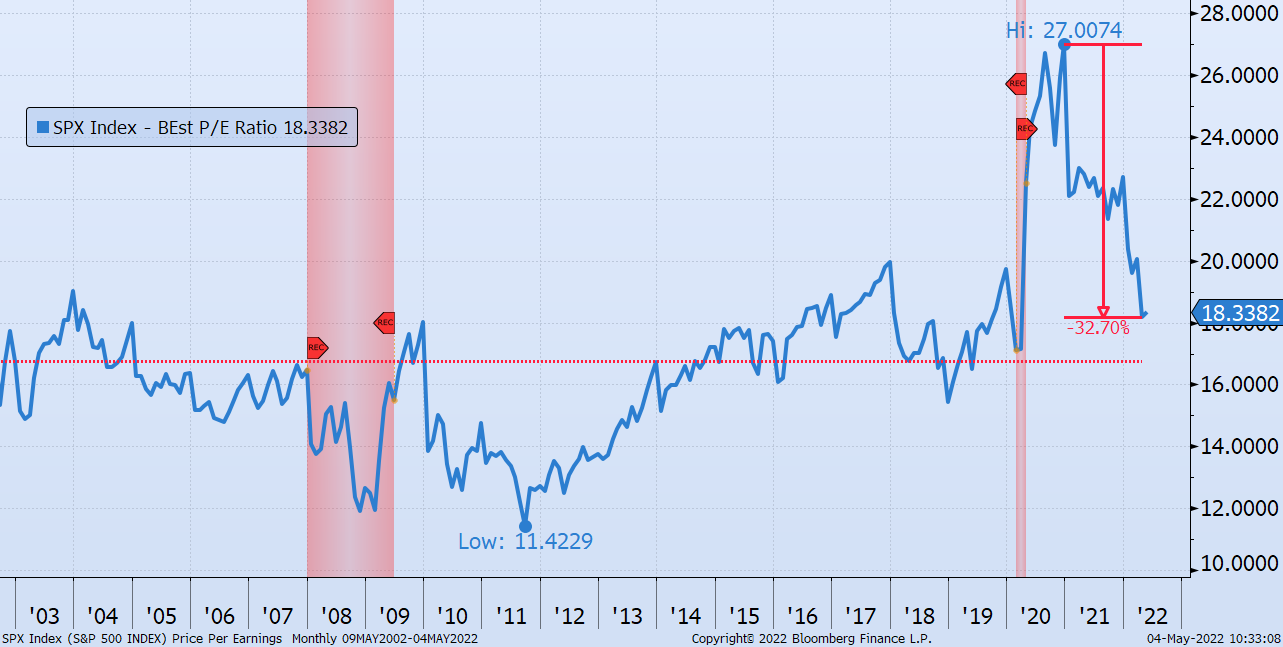
This chart shows the price for $1 in earnings from all the companies in the S&P 500 index for the last 20 years. In a nutshell, you would rather pay the lowest price of $11 in 2011 for that $1 worth of earnings, and not the highest price of $27 in 2020.
As companies continue to earn more, and due to the recent downturn in the value of the S&P 500, the current price has fallen to $18, which is a 33% discount from the peak, and more in line with the historical average of $17.
As a long term investor (aka long term buyer), the “when to buy” calculation is immaterial. The return from buying at the worst time just before the Great Recession 2008 still provided you a healthy 9.2% a year vs. 3.1% a year in bonds.
However, if you sell, the last thing you want to do is to go against the rule of thumb from above, since if you sold today, essentially you would be “selling low.”
Samuel serves as Senior Vice President, Chief Investment Officer for the Crews family of banks. He manages the individual investment holdings of his clients, including individuals, families, foundations, and institutions throughout the State of Florida. Samuel has been involved in banking since 1996 and has more than 20 years experience working in wealth management.
Investments are not a deposit or other obligation of, or guaranteed by, the bank, are not FDIC insured, not insured by any federal government agency, and are subject to investment risks, including possible loss of principal.